The National Allowances Plan for 2022-2025 was developed in accordance with paragraph 2 of Article 290 of the Environmental Code of the Republic of Kazakhstan.
• The main goal of the National Allowances Plan is to allowance carbon dioxide emissions from allowance entities for the period 2022-2025 in order to ensure compliance with national and international commitments to reduce greenhouse gas emissions (hereinafter referred to as GHG) based on a market–based GHG emissions trading mechanism.
• An allowance entity is an operator of installation whose GHG emissions exceed 20,000 tons of CO2.
• According to Article 291 of the Environmental Code of the Republic of Kazakhstan, the distribution of carbon allowance units among allowance entities is carried out on the terms of their free distribution and sale through an auction within the volumes determined by the National Allowances Plan.
• Carbon allowance units within the scope of the National Allowances Plan may be transferred from one reporting period to another. Unused (outstanding) carbon allowance units are not transferred to the next National Allowances Plan.
• The carbon allowance units expire on the first of October of the year following the last reporting year of the corresponding National Allowances Plan on the basis of which they were allocated.
Data on the distribution of carbon units by regulated sectors of the economy according to the National Allowances Plan for the 2022-2025
|
Year |
Regulated sector of the economy |
Number of installations |
Number of carbon units |
Emission volume, tons of CO2 |
Carbon units withdrawn |
Additional carbon units issued |
Total at the end of the year |
Carbon unit trading |
|
|
Bought |
Sold |
||||||||
|
2022 |
Electrical power industry |
95 |
95 304 595 |
96 084 989 |
5 682 888 |
7 221 267 |
757 985 |
3 554 166 |
1 476 927 |
|
Oil and gas industry |
53 |
23 039 151 |
19 751 772 |
1 412 463 |
1 765 160 |
3 640 076 |
414 769 |
370 454 |
|
|
Mining industry |
22 |
7 334 212 |
3 205 913 |
303 765 |
169 168 |
3 993 702 |
4 539 |
1 150 090 |
|
|
Metallurgical industry |
20 |
30 747 135 |
26 018 848 |
3 819 274 |
15 554 |
924 567 |
40 264 |
0 |
|
|
Chemical industry |
7 |
1 715 105 |
1 573 949 |
94 974 |
27 132 |
73 314 |
49 510 |
0 |
|
|
Processing industry |
15 |
8 019 802 |
8 481 675 |
235 598 |
1 866 955 |
1 169 484 |
80 829 |
49 093 |
|
|
Carbon offset projects |
- |
- |
- |
- |
- |
- |
339 232 |
1 436 745 |
|
|
|
|||||||||
|
2023 |
Electrical power industry |
97 |
93 872 608 |
94 258 698 |
5 952 205 |
6 655 378 |
317 083 |
2 306 781 |
1 039 482 |
|
Oil and gas industry |
60 |
22 692 974 |
21 291 840 |
1 475 018 |
2 154 363 |
2 080 479 |
321 540 |
134 074 |
|
|
Mining industry |
21 |
7 224 012 |
3 051 153 |
91 007 |
70 483 |
4 152 335 |
229 347 |
1 456 803 |
|
|
Metallurgical industry |
21 |
30 285 148 |
24 278 420 |
4 868 812 |
295 175 |
1 433 091 |
82 287 |
261 824 |
|
|
Chemical industry |
7 |
1 689 335 |
1 444 152 |
275 537 |
20 740 |
-9 614 |
42 006 |
0 |
|
|
Processing industry |
17 |
7 899 302 |
8 606 014 |
594 797 |
2 056 600 |
755 091 |
50 560 |
53 631 |
|
|
Carbon offset projects |
- |
- |
- |
- |
- |
- |
0 |
86 707 |
|
|
|
|||||||||
|
2024 |
Electrical power industry |
98 |
94 343 363 |
94 757 652 |
5 996 869 |
6 001 430 |
-443 271 |
2 459 548 |
1 373 879 |
|
Oil and gas industry |
60 |
22 921 486 |
22 001 845 |
1 665 043 |
2 432 530 |
1 687 128 |
595 903 |
449 555 |
|
|
Mining industry |
22 |
2 864 801 |
2 813 632 |
88 090 |
270 724 |
233 803 |
89 425 |
992 821 |
|
|
Metallurgical industry |
23 |
30 383 809 |
27 540 342 |
3 349 914 |
1 632 585 |
1 126 138 |
926 098 |
433 216 |
|
|
Chemical industry |
8 |
2 464 510 |
1 767 508 |
193 714 |
33 513 |
536 801 |
61 354 |
0 |
|
|
Processing industry |
18 |
9 109 279 |
8 597 504 |
872 561 |
1 180 028 |
819 242 |
94 477 |
230 118 |
|
|
Carbon offset projects |
- |
- |
- |
- |
- |
- |
1 330 043 |
2 077 259 |
|
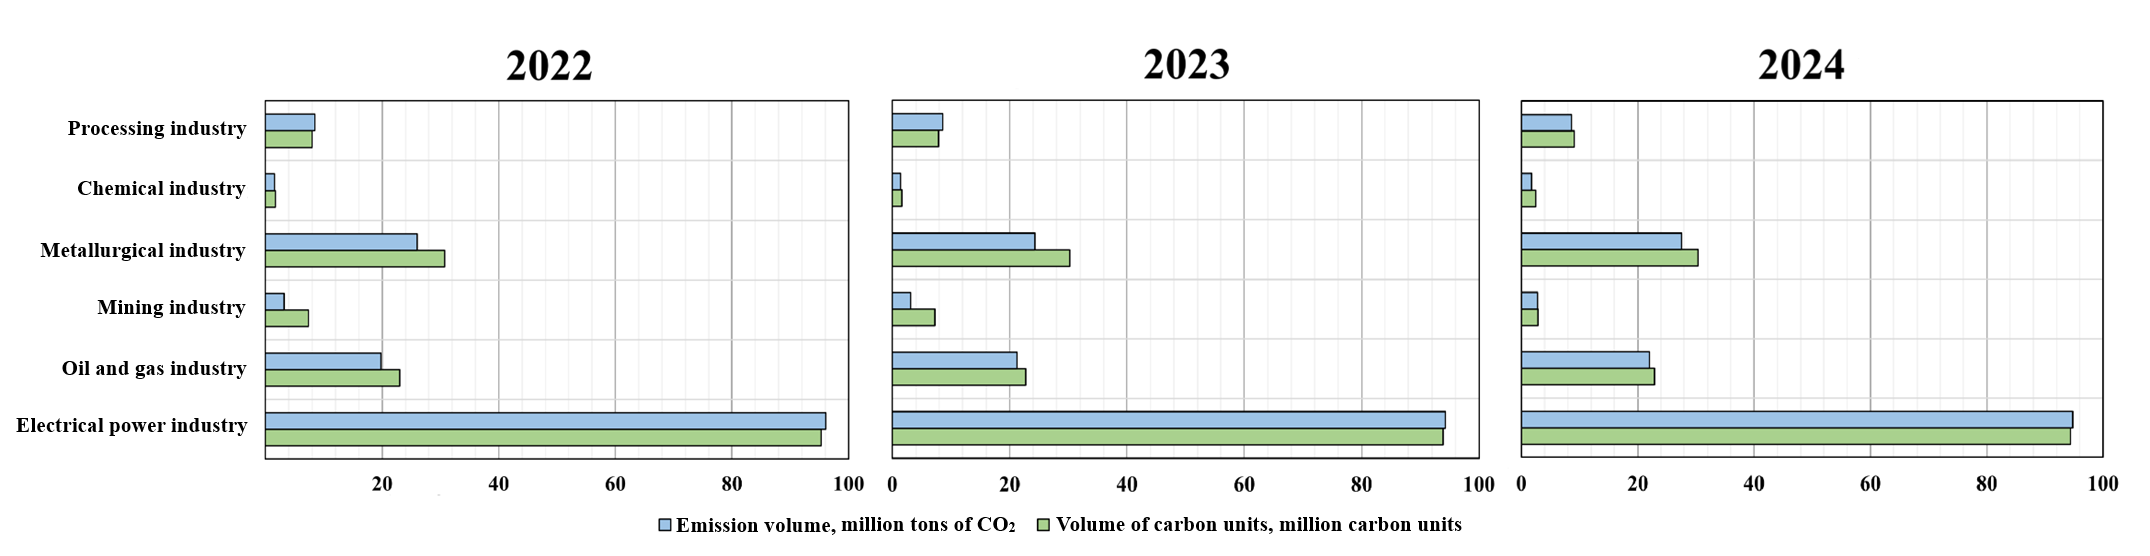
Volumes of carbon units and CO2 emissions, by regulated sectors of the economy
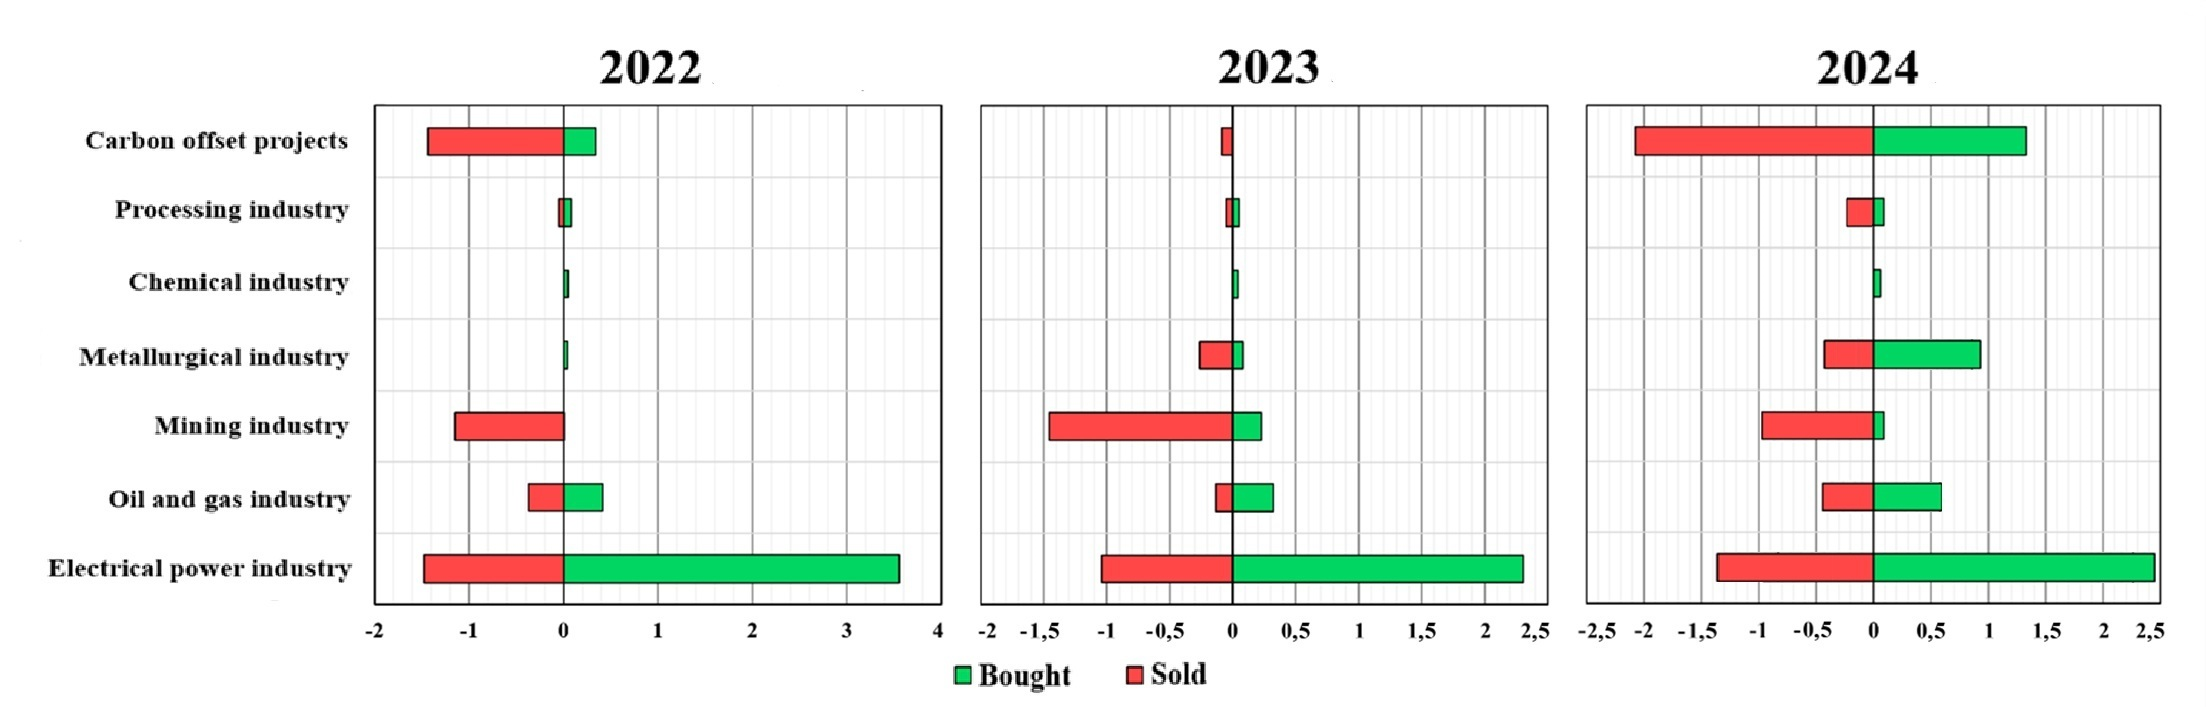
Carbon unit trading volumes, by regulated sectors of the economy, million carbon units

 EcoQolday
 Check payment
 Login to the system
